- Products
- 123SCADA Platform
- Reporting
123SCADA Reporting and Data Analysis
The 123SCADA platform includes over 50 pre-built reports and data analysis tools purpose-designed for water and wastewater utility operations. Every report is included with the Mission annual service plan at no additional cost, accessible from the secure web portal on any device, and available for download as spreadsheets for further analysis.
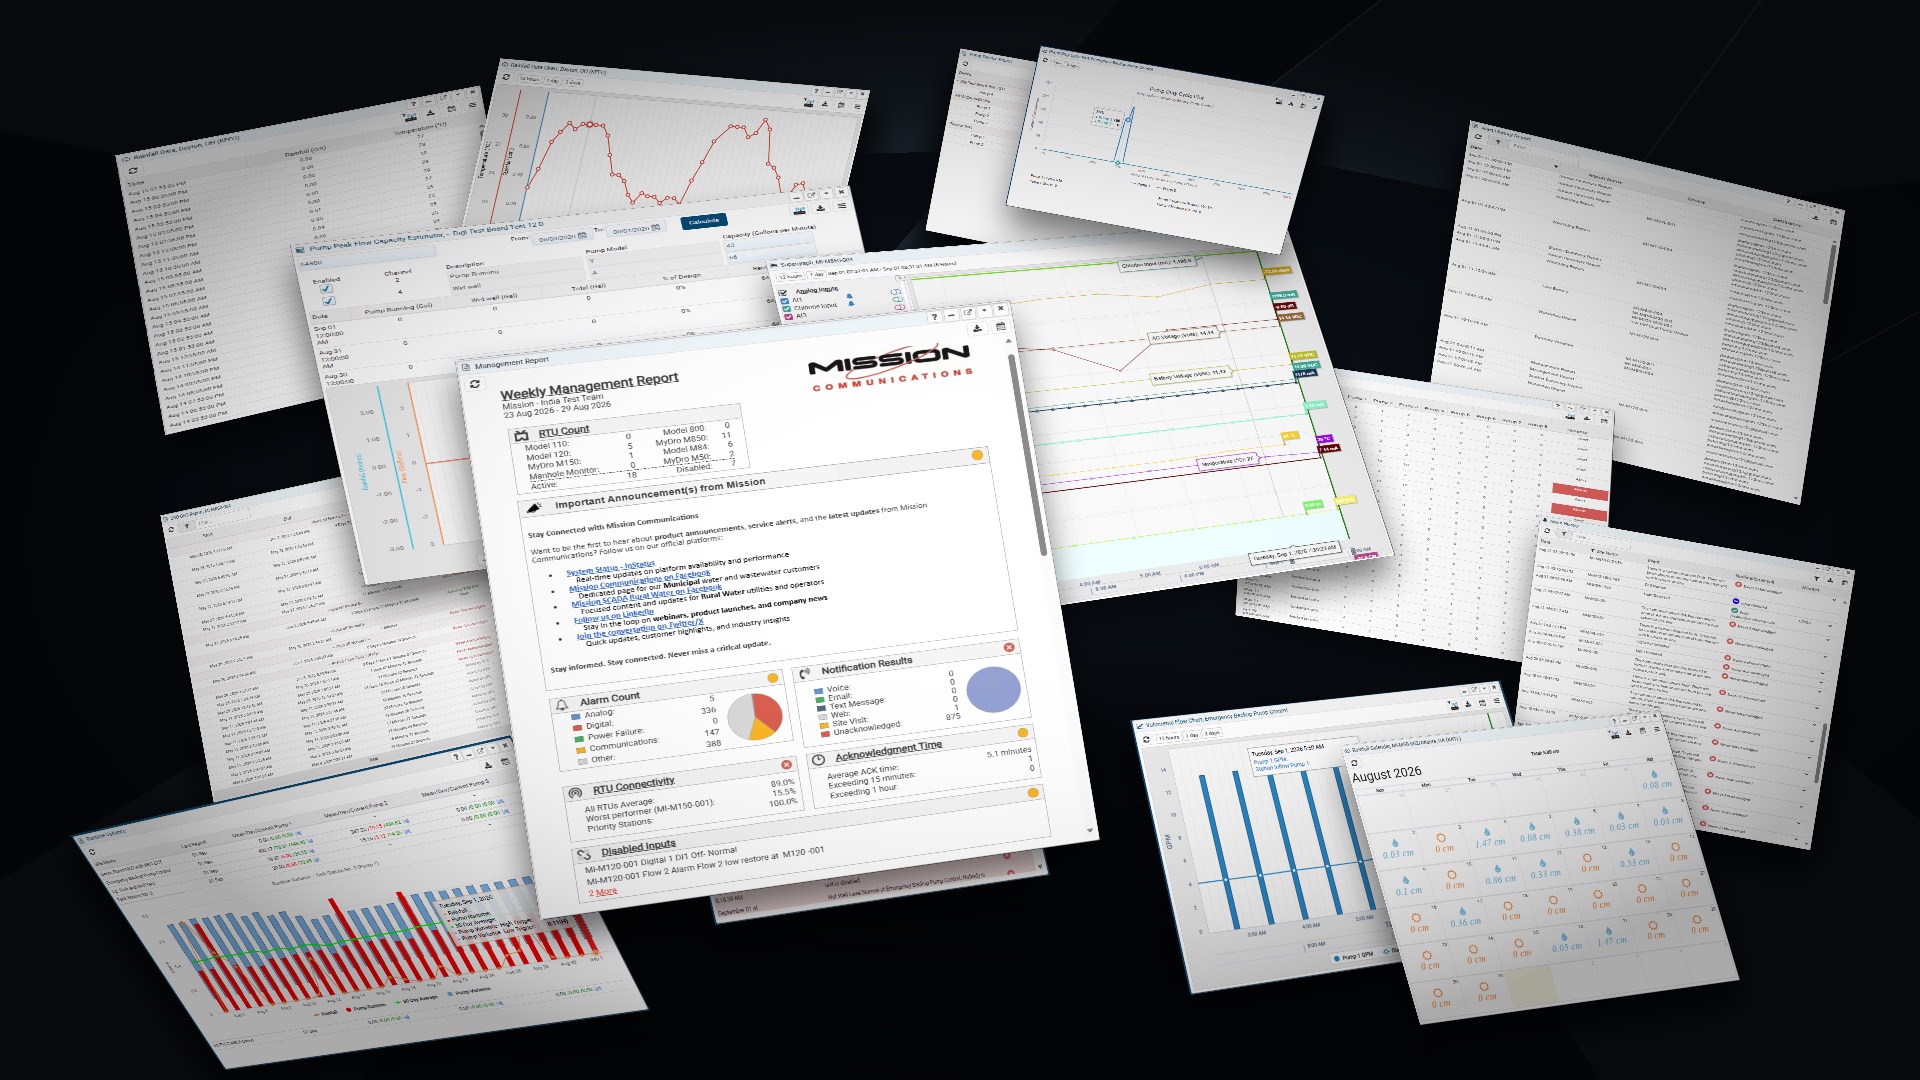
All Your Reports. One Place.
Reports are grouped by what you are trying to answer.
Pump Performance
Runtime, start counts, and lead/lag comparisons that flag maintenance needs before failures occur.
Analog and Digital Data
Levels, pressures, flows, and water quality trends, plus timestamped state changes for every digital input.
Flow and Volume
Totalized flow, multi-day comparisons, and volumetric calculations for production and consumption.
Compliance and Regulatory
SSO/CSO event tracking, SDWA chlorine residual reports, and rainfall correlation for I&I analysis.
Engineering and Capacity
Capacity estimates, volumetric flow calculations, and pump efficiency tracking to plan for growth.
Management and Operational
Weekly summaries, disabled inputs, site and portal access logs, and unit health across the system.
Pump Performance Reports
Track pump health, efficiency, and runtime patterns with detailed pump performance reporting. These reports help operators identify maintenance needs before failures occur and optimize pump cycling for energy savings.
- Pump runtime summaries: daily, weekly, and monthly totals with variance analysis
- Pump start counts: identify excessive cycling that indicates control or level sensor issues
- Multi-pump runtime comparison: side-by-side analysis for lead/lag optimization
- Simultaneous pump runtime reports for monitoring peak demand periods
- Graphical trending showing runtime patterns over configurable time periods
Analog and Digital Data Reports
Comprehensive data reporting for every sensor connected to Mission RTUs. Analog reports display continuous measurements such as levels, pressures, flows, and water quality parameters. Digital reports track discrete state changes for switches, contacts, and status inputs.
- Analog trending: interactive graphs with configurable time ranges and threshold overlays
- Comparative analysis: overlay multiple analog inputs on a single Supergraph timeline
- Digital state logs: event-by-event recording with timestamps and duration calculations
- Historical data access: all data stored indefinitely with no time limits on retrieval
- Data export: download any dataset to spreadsheet format for external analysis
Flow and Volume Reports
Flow reports provide accurate water production and consumption tracking. Flow data is calculated from pulse-based flow meters or analog integrated flow signals and transmitted to the 123SCADA platform for real-time and historical analysis.
- Totalized flow: daily, weekly, and monthly totals with graphical trending
- Multi-day flow comparisons for identifying usage patterns and detecting anomalies
- Volumetric calculations based on level sensor data or fixed entries
- Configurable alarms for high-flow and no-flow conditions
Compliance and Regulatory Reports
123SCADA includes specialized reports designed to simplify regulatory compliance for water and wastewater utilities. These reports provide the documentation needed for state and federal reporting requirements.
- SSO/CSO monitoring: Sanitary sewer overflow and combined sewer overflow event tracking with automatic timestamps, duration, and volume estimation
- Safe Drinking Water Act (SDWA) compliance reports for chlorine residual and water quality monitoring
- Chlorine monitoring: real-time residual tracking with alarm thresholds for regulatory limits
- Rainfall integration: tipping bucket data correlated with system events for I&I analysis
Engineering and Capacity Reports
Advanced analytical tools help engineers assess system capacity and plan for infrastructure needs.
- Capacity estimator: project system limits based on historical data trends
- Volumetric flow calculations for treatment plant and collection system analysis
- Pump efficiency tracking to identify degradation over time
Management and Operational Reports
Management-level reports provide system-wide visibility into operational health, security, and team activity.
- Weekly management summaries: overall system performance at a glance
- Disabled inputs report: identify RTUs with intentionally or accidentally deactivated monitoring
- Site access reports: electronic key reader activity for secure facility tracking
- Web portal access: user login history by user and IP address
- Unit health: check-in history, cellular connection quality, battery voltage, and solar panel performance
Automated Report Delivery
Stay informed with automated reports delivered straight to your inbox on the schedule you define. Reports are generated and emailed automatically, ensuring stakeholders receive timely performance data without logging in to the portal. All reports can also be accessed on-demand through the web portal or mobile app at any time.
More About 123SCADA
123SCADA Platform
Dashboards, alarms, reports, mobile app, security, and OPC-UA integration — the cloud platform included with every Mission RTU.
Platform overviewFeatures
Live map and data views, customizable desktops, alarm management, remote commands, and unlimited users with five access levels.
Explore FeaturesMobile App
The full web portal on a phone or tablet, plus QR-code RTU configuration, geolocation, camera-to-support, and push alarms.
Explore Mobile AppSecurity
Encrypted private cellular networks, a carrier-grade data center, 2FA, five levels of role-based access, and full activity logging.
Explore SecurityFrequently Asked Questions
What can 123SCADA reporting help teams understand?
123SCADA reporting helps teams understand trends, alarm history, asset performance, and changes over time.
How do cloud-based monitoring reports help operations?
Cloud-based reports make it easier to access system information from different locations and share results with relevant team members. That improves collaboration and helps users stay aligned on system performance.
Why is historical reporting useful in SCADA systems?
Historical reporting helps teams compare current behavior with past conditions. That makes it easier to identify recurring issues, measure performance, and support maintenance or operational reviews.
See the reports with your data
Request a demo and we’ll open the pump, flow, and compliance reports for a system like yours.