- Solutions
- Stormwater
- Rainfall
Rainfall MonitoringReal-Time Rain Gauge Data for Utilities and Municipalities
A rain gauge becomes just another tile on the 123SCADA map, and its data is available for correlation and reporting immediately.
Why Utilities Deploy Cellular Rain Gauges
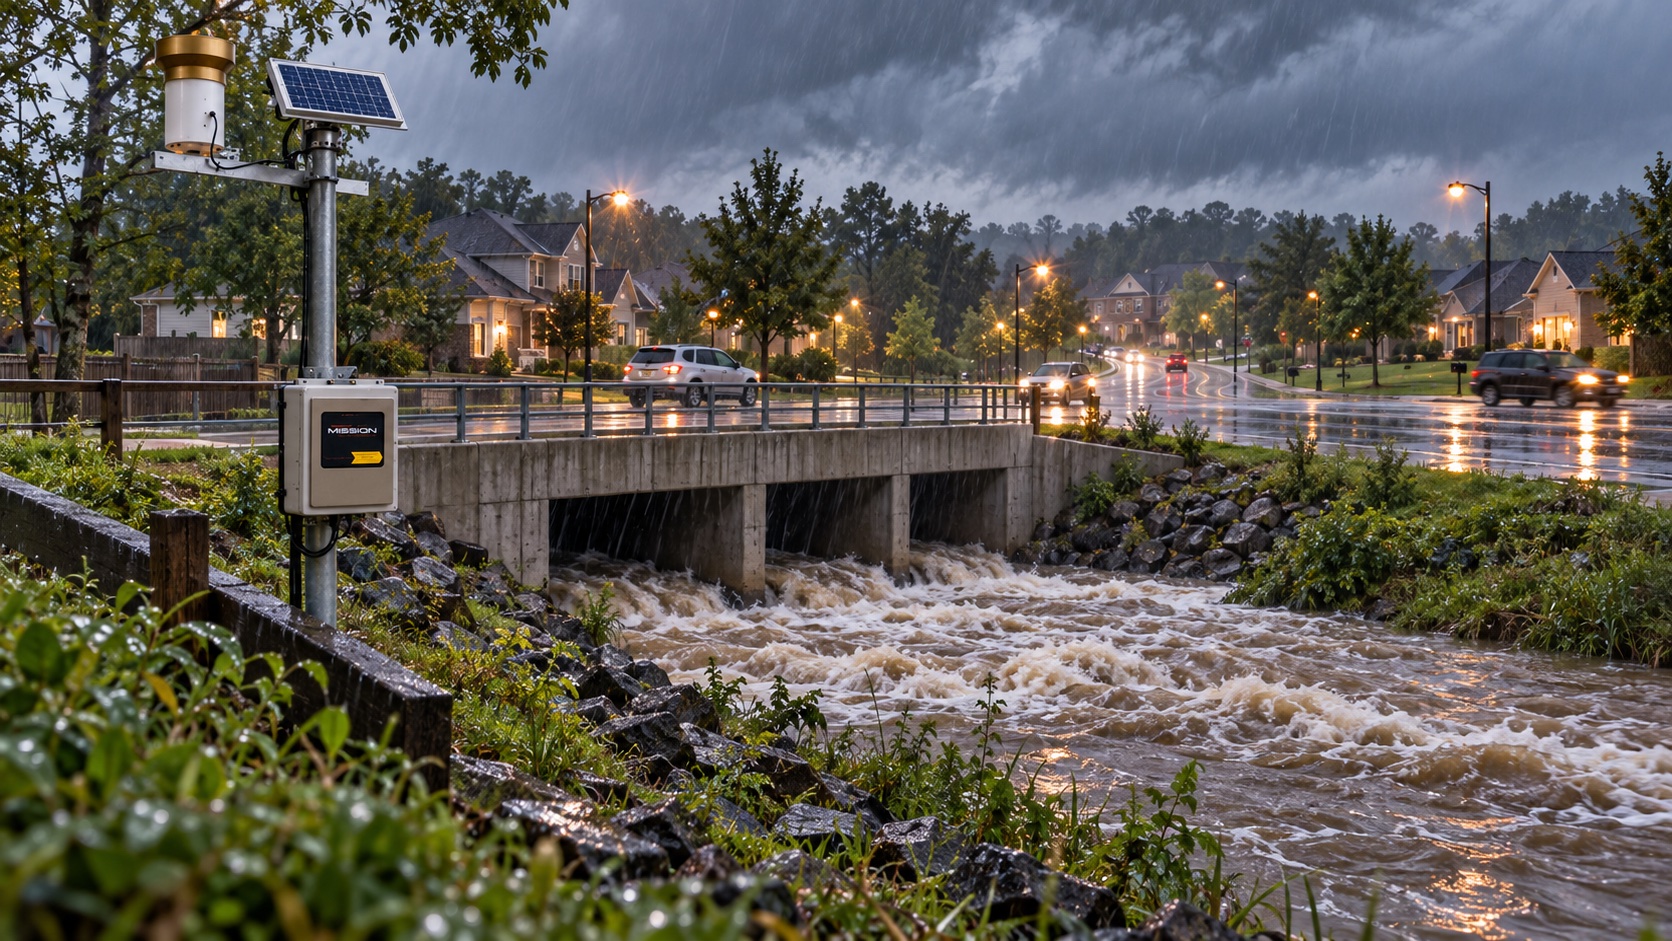
Rainfall monitoring is the foundation of every wet weather program. When a utility wants to know how much water entered the collection system, how quickly a lift station surged, or whether a pressure drop followed a storm, the first question is always ‘how much did it rain?’ Mission’s cellular rain gauges put that answer in the same dashboard as every other RTU in the system.
Because the gauges are cellular, there are no radio networks to license, no manual readings to collect, and no separate software to log in to. A rain gauge becomes just another tile on the 123SCADA map, and its data is available for correlation and reporting immediately.
How Mission’s Rainfall Monitoring Works
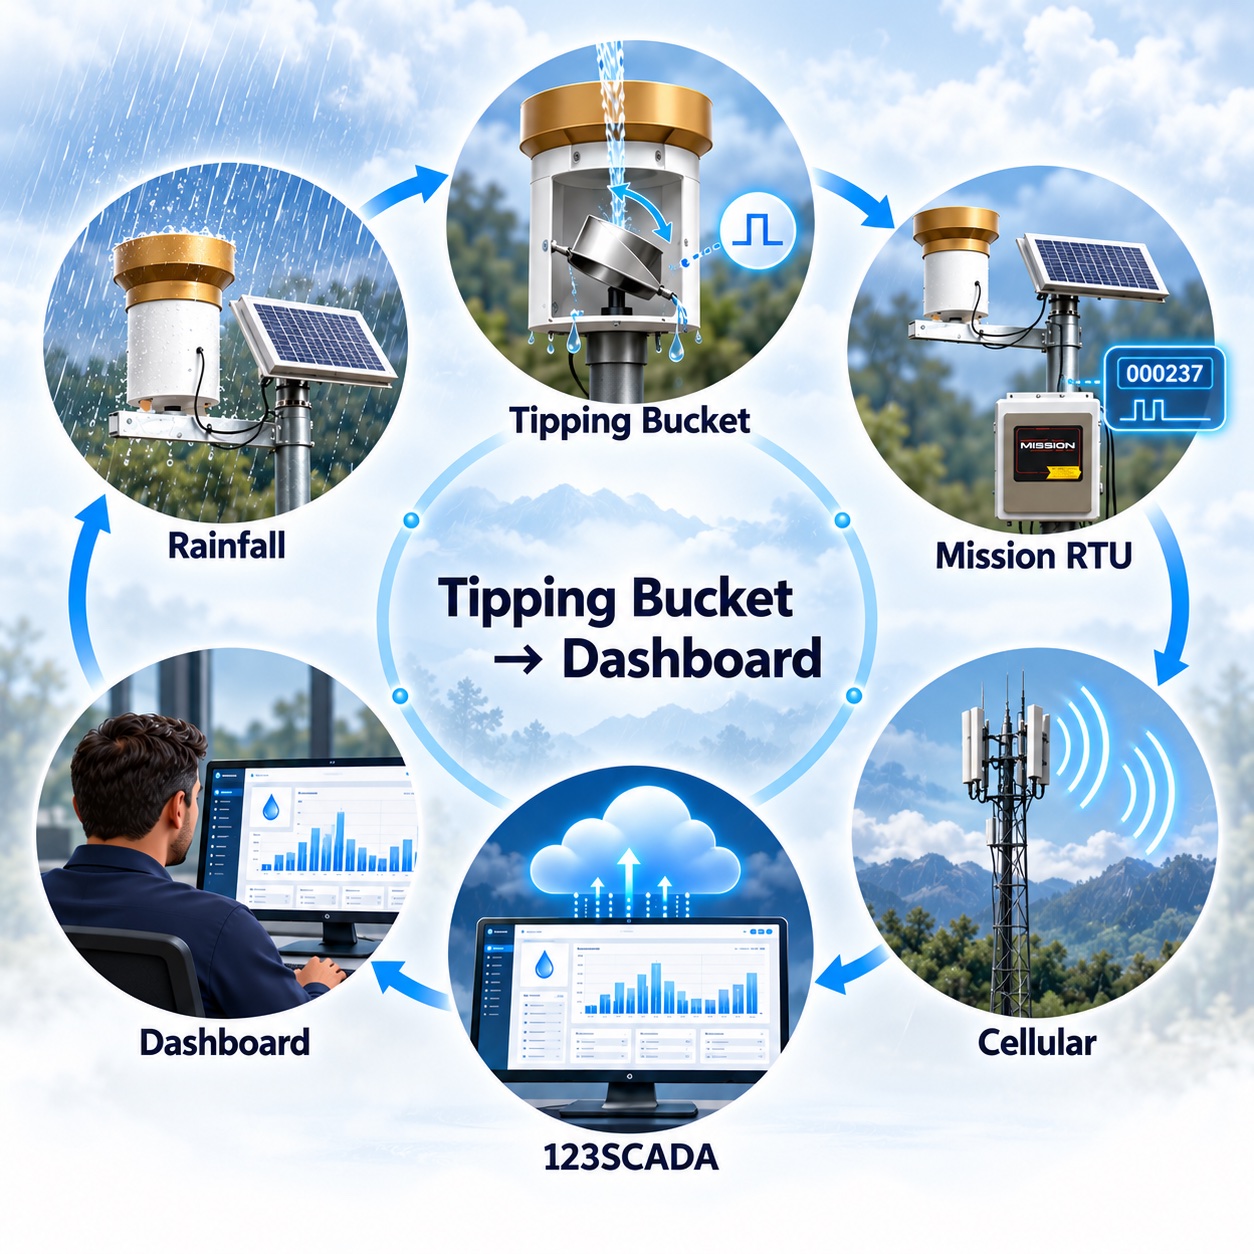
A standard tipping-bucket rain gauge connects to a Mission RTU via a simple digital input. Each tip of the bucket represents a fixed volume of rainfall — typically 0.01 inches — and the RTU counts tips in real time. Totals are reported on a configurable interval and at the end of each rainfall event.
The 123SCADA platform presents rainfall as hourly and daily totals, rolling period sums, and historical comparison graphs. Operators can view rainfall by site, by basin, or across an entire service area.
- User configurable rain tipping bucket resolution and unit
- Real-time and interval-based reporting.
- Historical trending from day one.
- Multi-site basin comparison and totals.
- Export to spreadsheet for engineering studies.
I&I Studies and Collection System Correlation
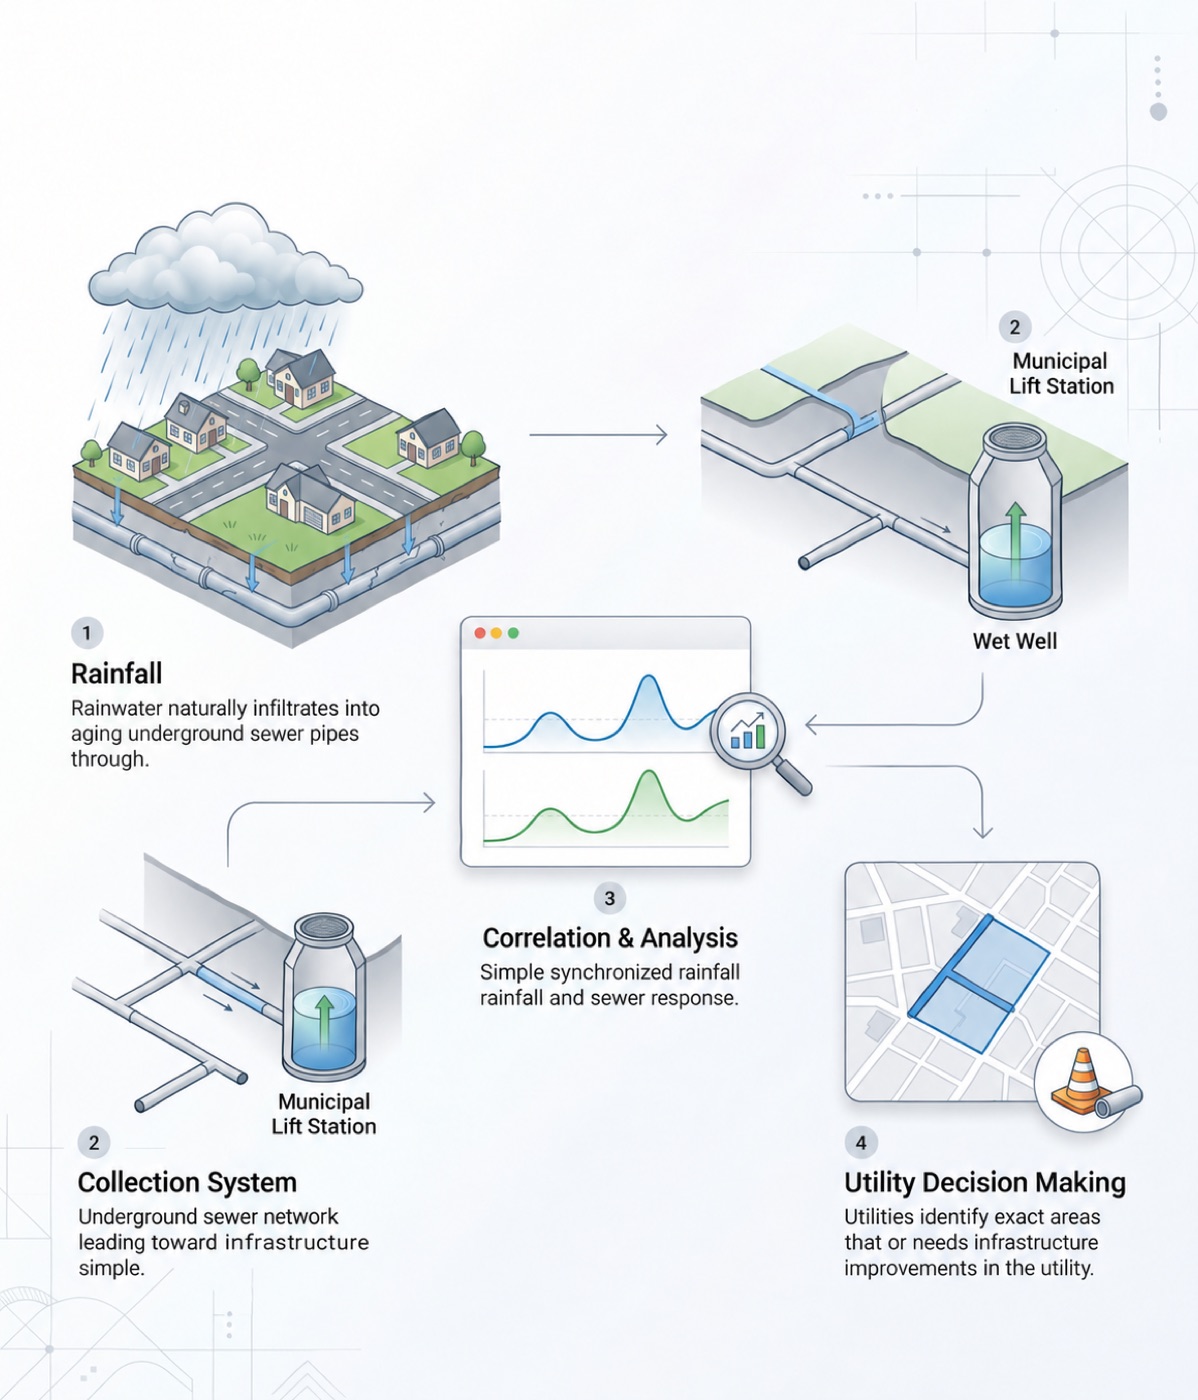
Inflow and infiltration (I&I) is the leading driver of sanitary sewer capacity problems in aging collection systems. A targeted I&I study uses rainfall data to identify which basins respond most aggressively to wet weather — pointing crews directly at the pipe segments where rehabilitation spending delivers the biggest return. Utilities use these reports to prioritize capital planning, defend sewer rate increases, and satisfy consent decree documentation requirements.
MS4 Permit Reporting
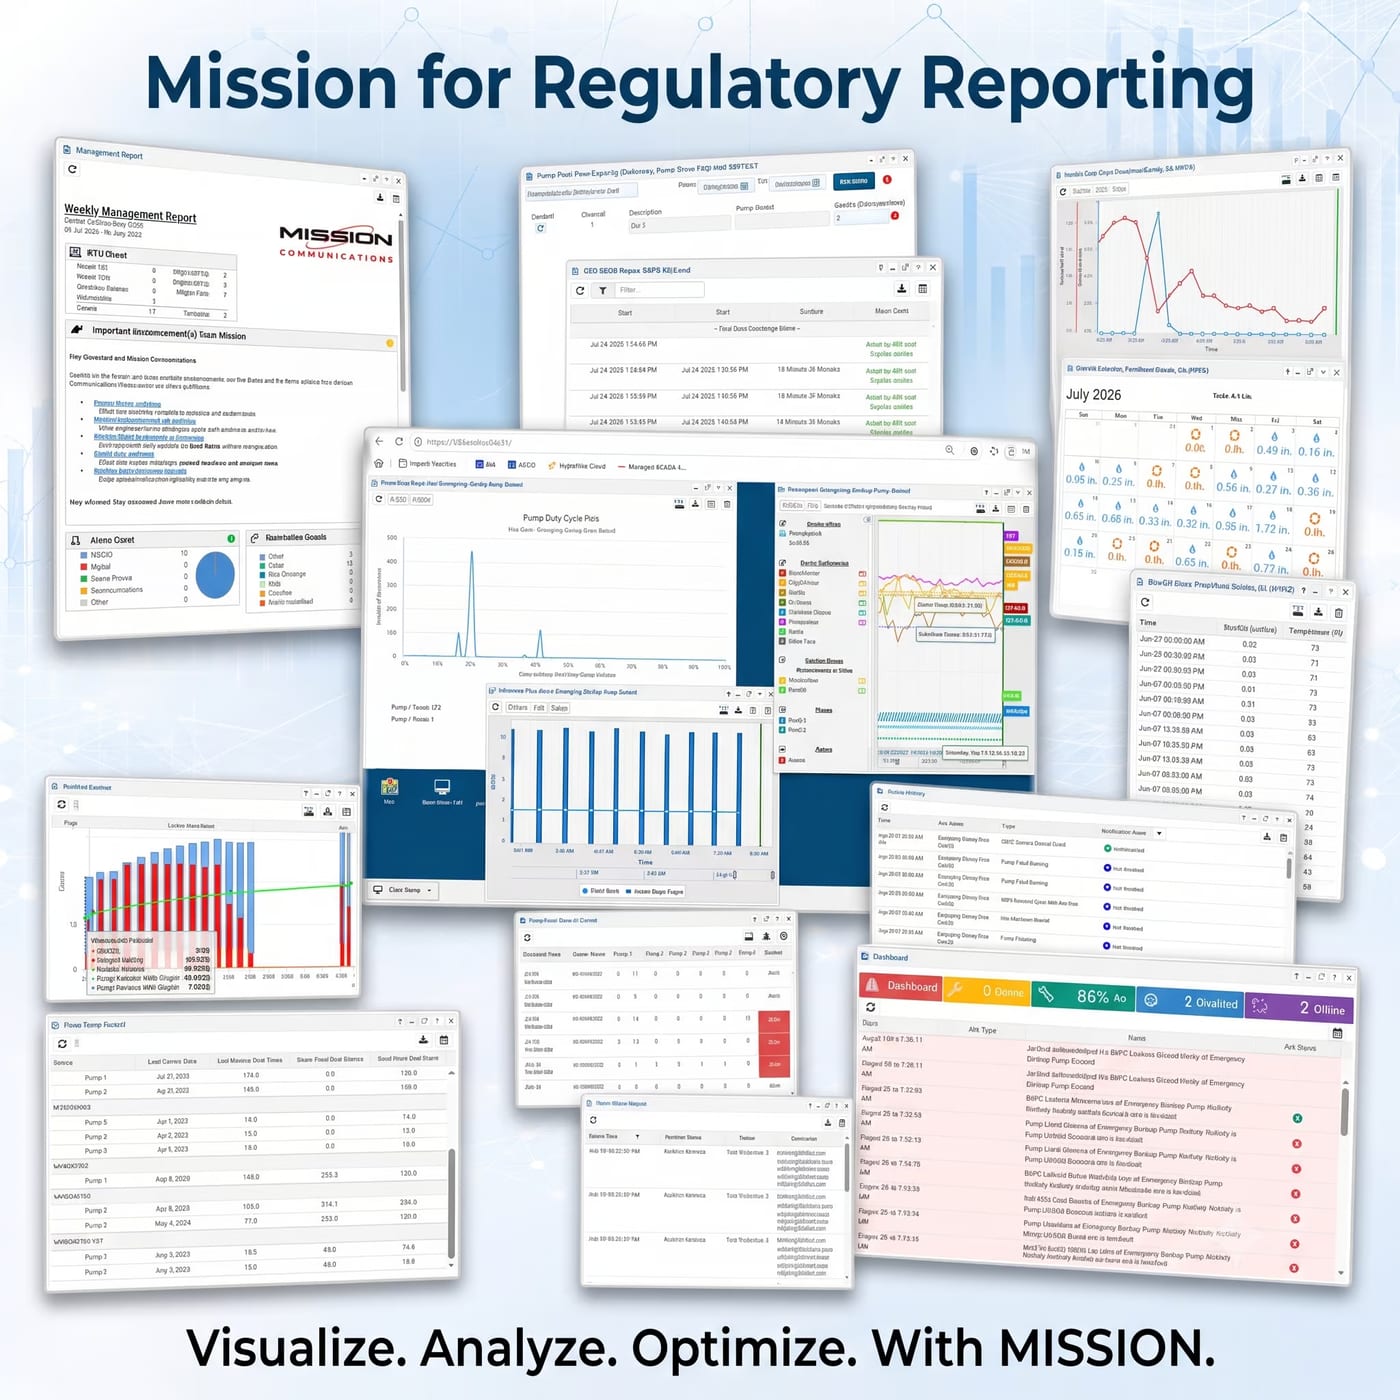
Municipalities under MS4 Phase I and Phase II permits need continuous rainfall data to document wet weather response and support illicit discharge investigations.
Mission’s rain gauges deliver timestamped, defensible records in formats that drop directly into annual reports.
All historical data is retained from the date of installation, eliminating any concern about local data loggers failing or storage cards filling up.
Flood Warning Triggers
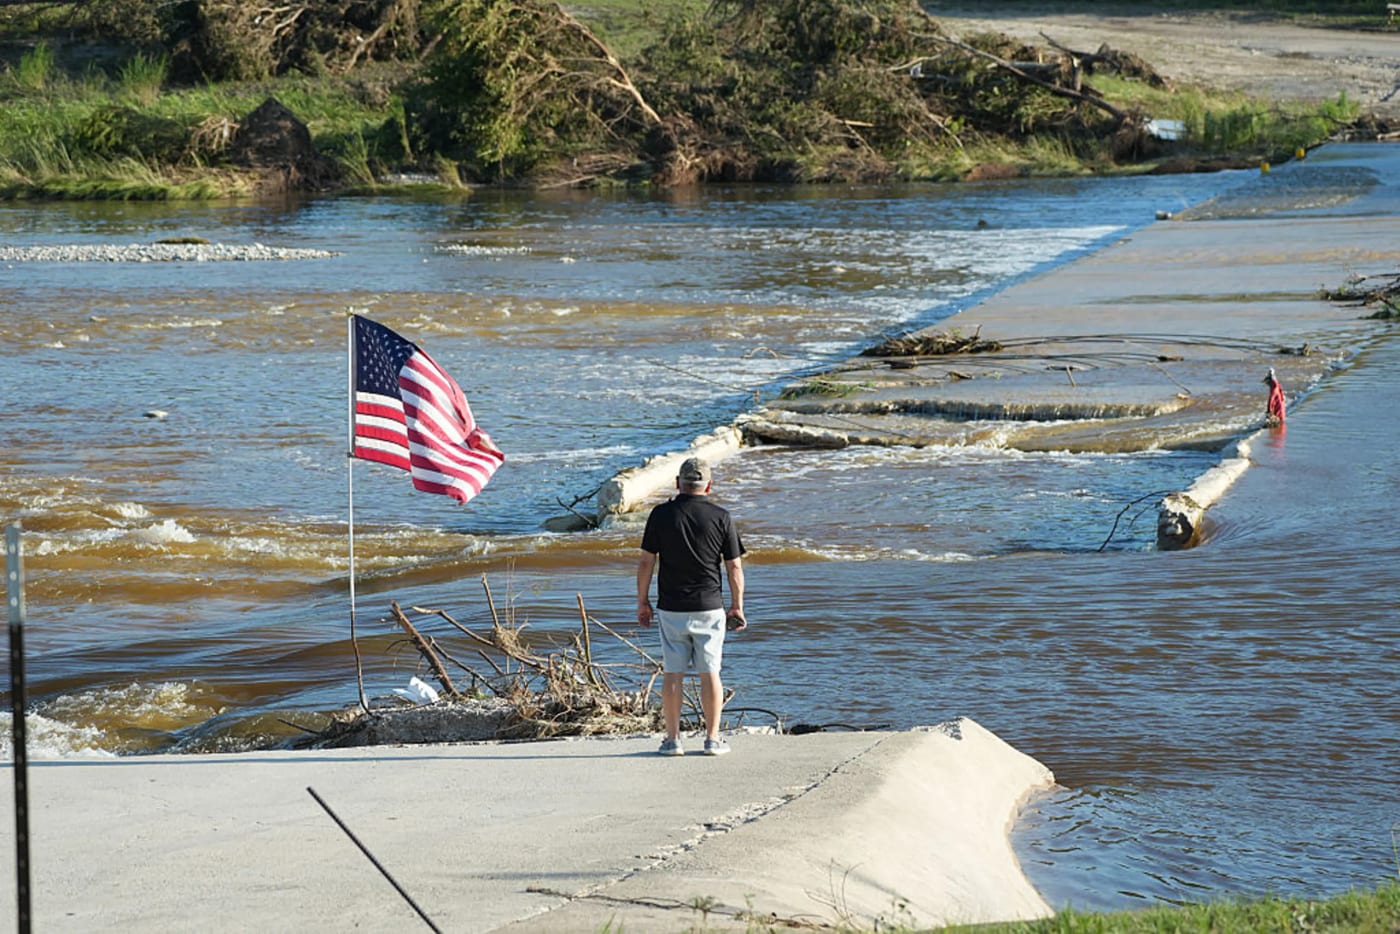
Rainfall data also feeds flood warning systems. When accumulated rainfall in a watershed crosses a defined threshold, 123SCADA can dispatch early warning notifications to emergency managers and road crews — well before downstream stream gauges show rising levels.
This forward-looking alerting buys public safety teams precious extra minutes.
What You Will Need
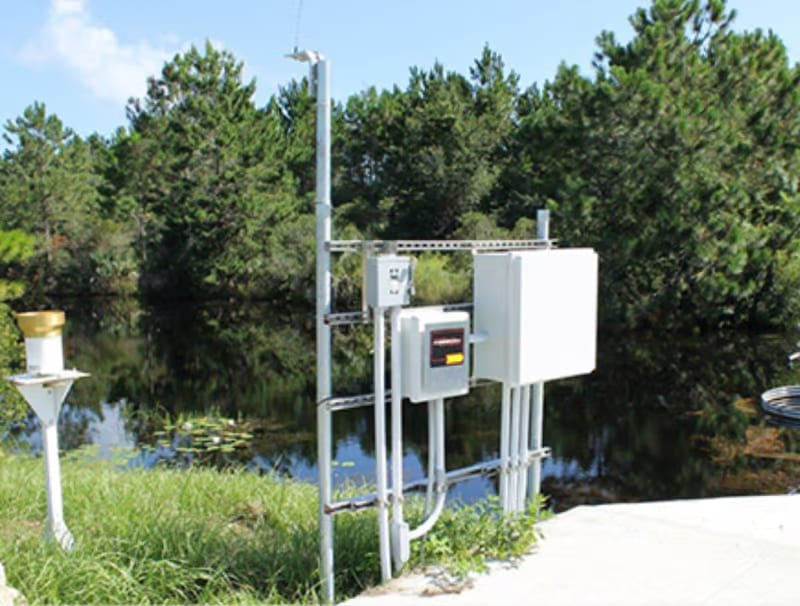
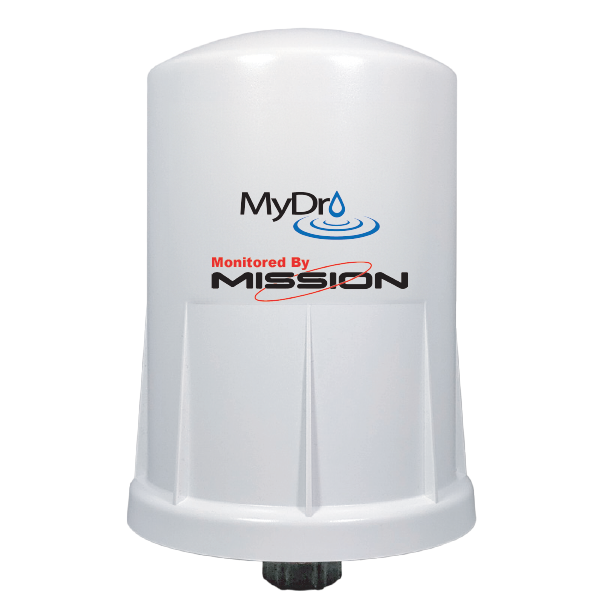
The MyDro 54R rainfall package ships with the tipping bucket and mounting hardware; line-powered MyDro RTUs count pulses through the Safe Module Plus. All RTUs include cellular data charges in the annual subscription—there are no separate data overage fees or early termination penalties.
MyDro 50
A battery-powered RTU for small stations without reliable power, using solar charging and ultra-low-power cellular communication for years of maintenance-free operation.
View MyDro 50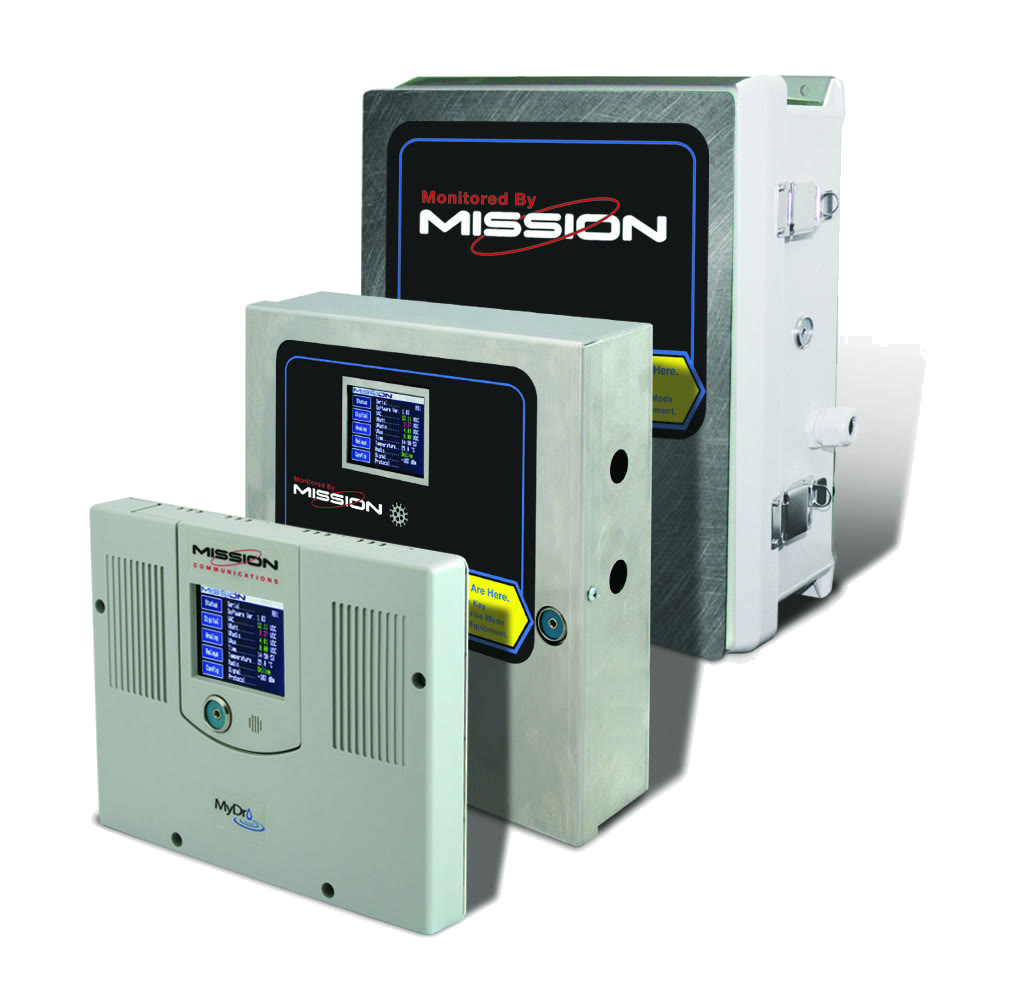
MyDro 850
The full-featured, line-powered RTU with the most extensive I/O capacity. Ideal for larger stations requiring multiple analog and digital inputs, relay outputs for remote control, and expansion module support.
View MyDro 850Not sure which RTU fits your site?
Compare every Mission RTU side by side, from line-powered to battery and solar. Or ask our team which one suits your site.
Flood Warning
Stream and low-water-crossing monitoring that alerts emergency managers in under a minute and documents every event.
Explore Flood Warning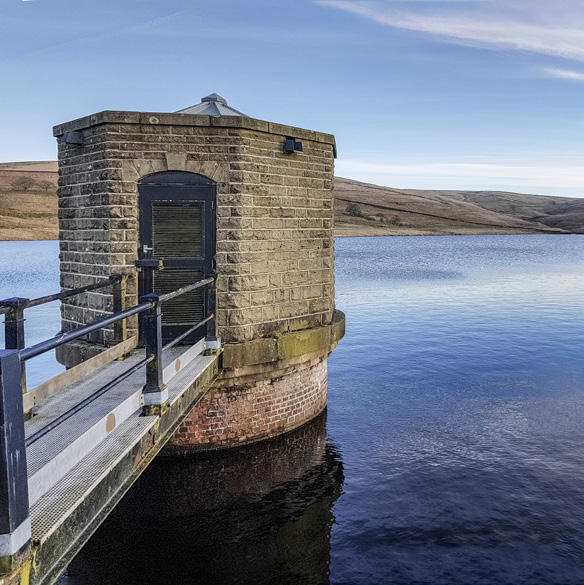
Reservoir & Lake Level
Live level, rate of change, and threshold alarms for reservoirs, lakes, rivers, canals, and detention basins.
Explore Reservoir & Lake LevelSee all Stormwater solutions
Every application Mission monitors and controls, with the alarms, reports, and hardware for each.
View all StormwaterFrequently Asked Questions
How is rainfall measured in a monitoring system?
Rainfall is commonly measured using gauges such as tipping bucket devices that record precipitation events and totals. That data is then sent to the monitoring platform so users can see live rainfall conditions and historical trends.
Why is real-time rainfall data valuable?
Real-time rainfall data helps operators understand current conditions as they happen instead of relying only on past reports. That is useful for flood preparedness, stormwater response, and understanding system behavior during wet weather.
Can rainfall monitoring support overflow prevention?
Yes. Rainfall monitoring helps teams connect incoming weather conditions to system performance. When operators know heavy rainfall is occurring, they can watch vulnerable assets more closely and respond earlier if overflow risk increases.
Get Started with Rainfall Monitoring
A single rain gauge site can be installed in an hour. A county-wide network can be deployed in days. Call 877.993.1911 or request a demo by clicking below.